Available Uptime Reports: how to access and interpret the data
Available Uptime Reports are an essential tool for monitoring the operational continuity of your systems and analyzing any downtime periods. This feature allows you to continuously check the status of your services through regular measurements designed to provide accurate and reliable data.
From this section, you can quickly review availability metrics, identify service interruptions, and better understand overall performance trends over time.
How to access the feature
To view uptime reports, log in to your client area and follow these steps:
- Access the Client Area: sign in to your management panel.
- Locate the feature: within the dashboard, find the Available Uptime Reports section.
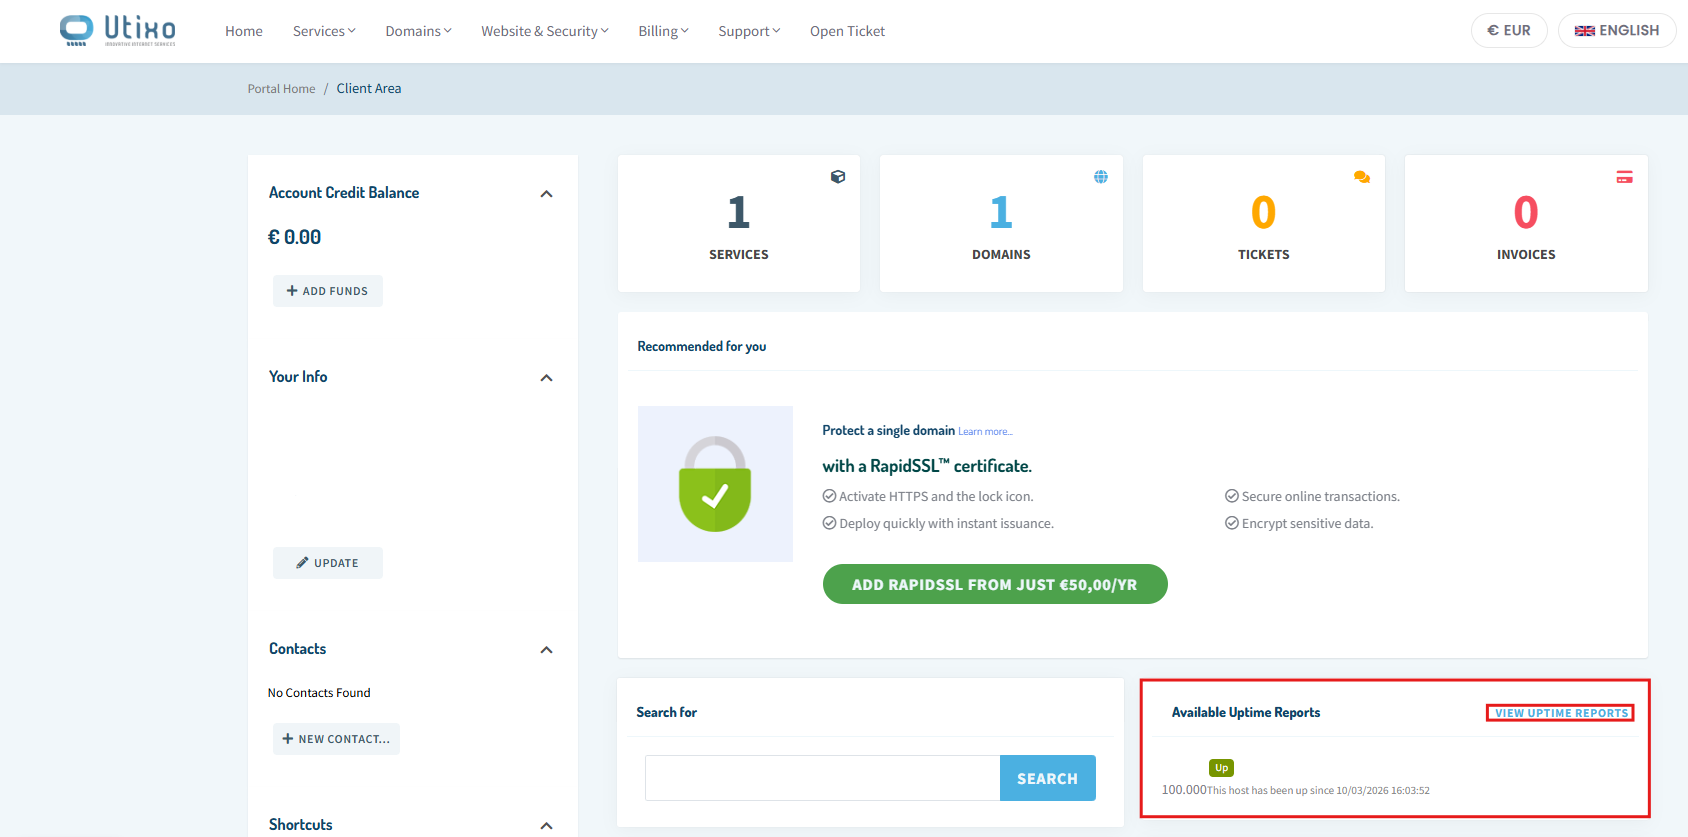
- Open the report: click View Uptime Report to access the monitoring details.
How to read the available data
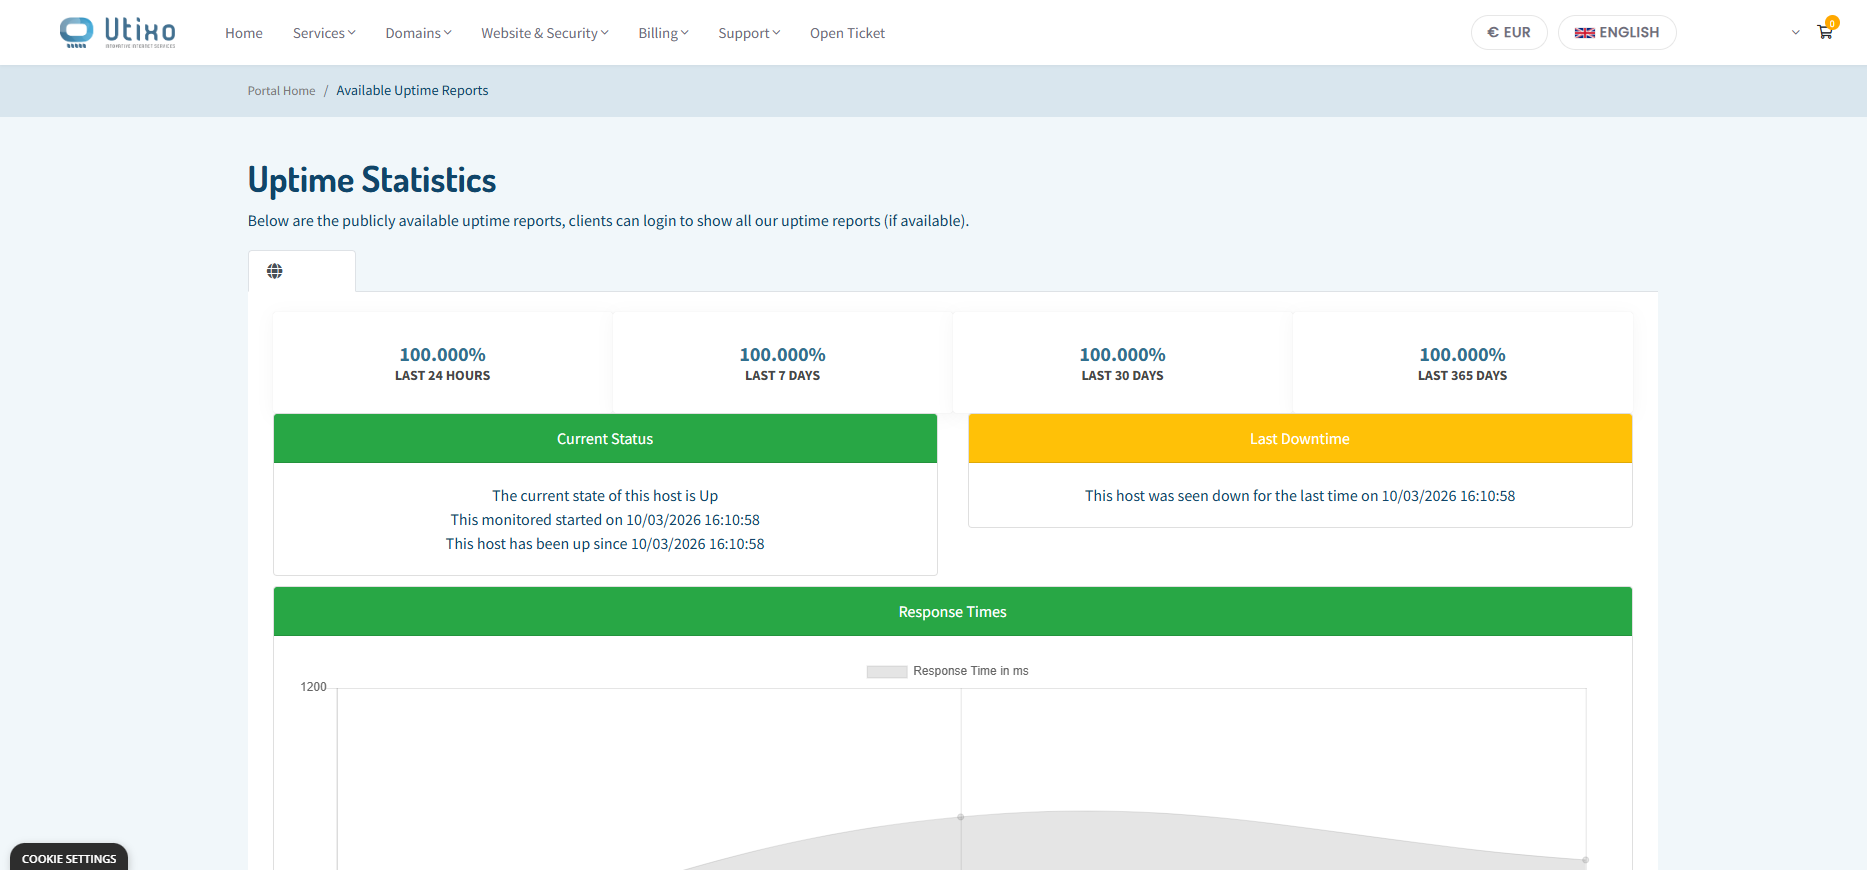
Once you open the report screen, you will find several tools that help you analyze service availability and investigate any irregularities in greater detail.
Time filters
You can filter uptime and downtime data by different time ranges: 1 day, 1 week, 1 month, or 1 year. This makes it easier to identify recent issues and evaluate long-term service reliability.
Response time chart
Below the availability data, you will find a chart dedicated to response times. This allows you to check not only whether the service was available, but also whether it maintained stable and consistent performance over time.
Measurement history
The system keeps a detailed measurement history, allowing you to track the exact date and time of any downtime recorded during the last year.
